evaluating field usage in excel / power query / power bi
RIP Field Trip…a great app it was. there are other apps now that do the same thing, and free ones to boot. I’m sure they are great but my new job has some hoops to jump through to install them so i tested out the idea i had years ago to do this using power bee eye.
The M language used in power query makes it remarkably easy to do this. It has a Table.Profile function, which takes a table as an input, and returns the usage, like magic.
You can use the salesforce integration to pull an object, and add one line of code in advanced editor, and you have it.
If you want to filter by record type, or any other field on the object, you can do that via the power query UI prior to adding the line of code to run the profile. It also is possible to do this dynamically by record type, but is more complex, so that will be a separate article.
Note that if you run this on your desktop and have an object with a lot of fields and a lot of records, your machine may get rather hot. Fortunately with a fairly cheap power BI Pro license, you can create a dataflow (gen 1) which can do all this in msft the cloud, and then you can analyze in power bi or you can reference the dataflow in as a data source in excel. Using dataflows makes this much faster, and less API calls against your salesforce instance.
Note that dataflows treat blank values as empty strings, while the regular salesforce connector treats them as null. This is important, because table.profile gives you a null count, but that value will be wrong if you use a dataflow. You can add a Table.Replacevalues prior to Table.Profile to replace all “” with null (replacing previous step name with the name of the actual previous step)
CleanData = Table.ReplaceValue(#"Previous Step Name","",null,Replacer.ReplaceValue, Table.ColumnNames(#"Previous Step Name"))
I will write this up in more detail, but at a top level - you pull in a salesforce object in power query via data - get data - from online services - from salesforce objects. Then you can go into advanced editor and the M code will look like
let
  Source = Salesforce.Data("https://login.salesforce.com/", [ApiVersion = 48]),
  #"Navigation 1" = Source{[Name = "Contact"]}[Data]
in
  #"Navigation 1"
and all you need to add is
profiledata = Table.Profile(#"Navigation 1")
so it becomes
let
  Source = Salesforce.Data("https://login.salesforce.com/", [ApiVersion = 48]),
  #"Navigation 1" = Source{[Name = "Contact"]}[Data],
  profiledata = Table.Profile(#"Navigation 1")
in
  profiledata
note the commas etc as M is a funny language. when you save the system will add a few additional lines but you dont need to worry about that…
reference this in power bi (which you need to do on power bi desktop, bc msft nonsense) or in power query, and you will see the magic
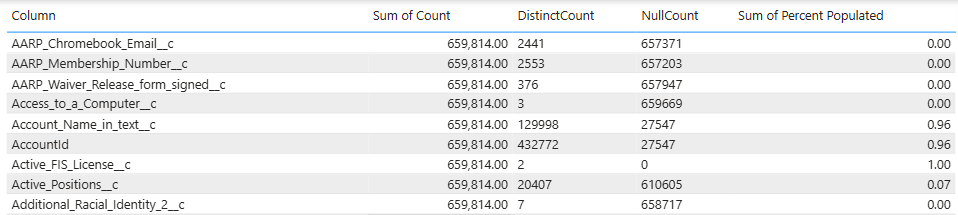
This will give you the following stats about each field
minimum
maximum
average
standard deviation
count
null count
distinct count
You also can add your own ‘additionalAggregates ’ functions, for example I added max length, so my line to add Table.Profile becomes:
  profiledata = Table.Profile(#"Navigation 1",
    {
      {
        "Max Length",
        each true,
        each List.Max
          (
          //text.from is needed to get length of integers
          List.Transform(_,each try Text.Length(Text.From(_)) otherwise null)
          )
      }
    }
  ),
UPDATE JAN 2026 > figured out a fairly elegant to do this dynamically by record type.
first, get all the data and group it by recordtype
use ‘all rows’ as output
this gives you a two column table
recordtype | case data
this means all the case data for that record type is in one nice little cell in the table, and is stored as a table.
That means you can run a profile on each cell! Add a custom column via the UI, and use the expression Table.Profile([caseData]) replacing caseData with whatever you called that column
Now you have just created the profiles by record type.
Remove the case data column - no longer needed. And expand the profile column so you can see profile by record type.
Screenshots etc coming soonish.